Reliable dew point measurement: what measurement data really demonstrate
Accuracy is only one aspect of measurement quality. For comprehensive process monitoring, long-term stability, repeatability, response time, behaviour after condensation and uninterrupted measurement output are equally important. Several test series for the TDS501 and EE355 show how these characteristics can be substantiated with measurement data.
Long-term stability: observed over years
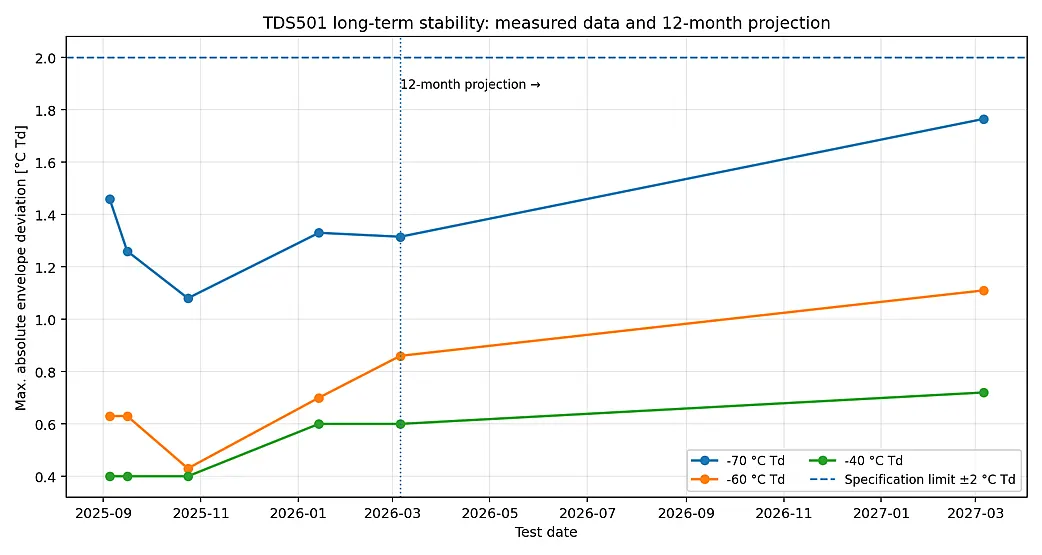
The long-term stability of the TDS501 was investigated separately using ten test units. The sensors were operated in Class 321 compressed air (DN50 compressed air line, 24-hour operation, typical dew point −60 °C (Td), pressure 8 bar and flow rate 100 Nm³/h) and repeatedly calibrated using a accredited certified dew point generator. The deviations at −70, −60 and −40 °C Td were evaluated over time as statistical envelopes. During the first six months, the determined envelopes at all three test points remained within ±2 °C Td. A 12-month projection was also derived from this trend. This projection likewise remains within the tolerance band. It is explicitly an extrapolation and not a long-term value that has already been measured.
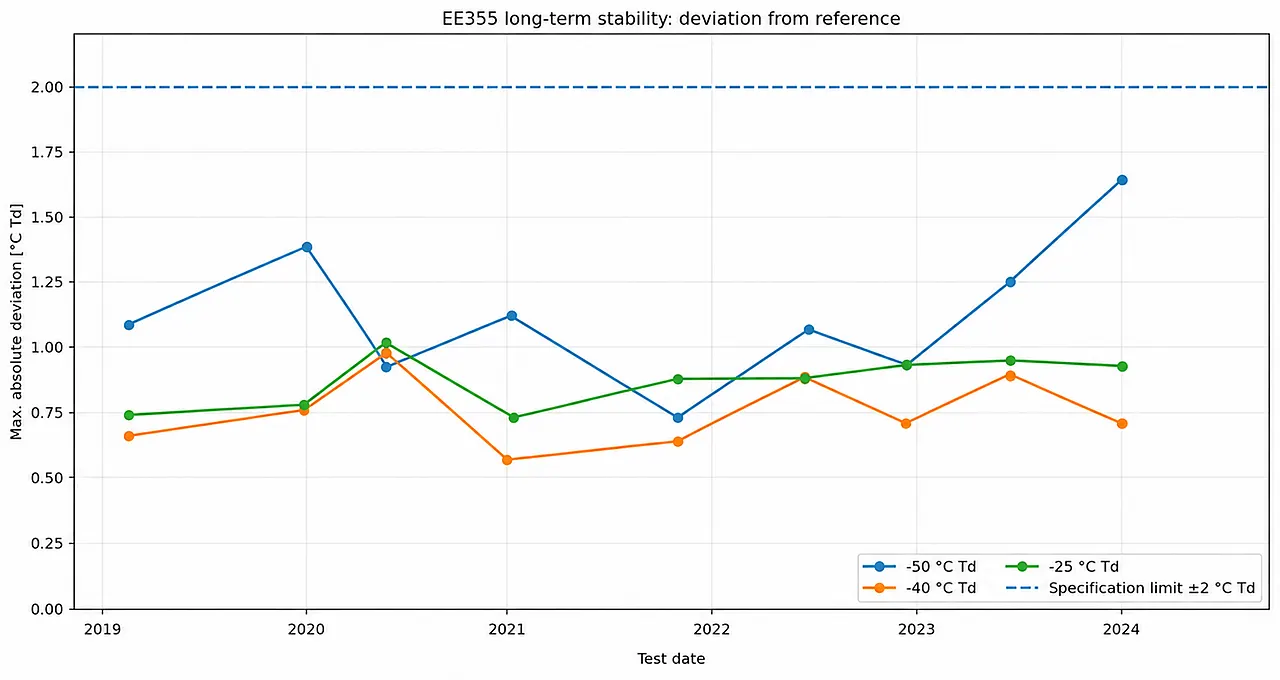
Long-term data are available for seven EE355 test units. Since March 2019, the transmitters have repeatedly been checked against a dew point reference at −50, −40 and −25 °C Td.
At −50, −40 and −25 °C Td, all available measurement deviations remained within the documented tolerance band of ±2 °C Td. The behaviour is particularly consistent at −40 and −25 °C Td: between the first and the latest measurement, the deviation of each test unit changed by no more than 0.41 °C and 0.39 °C Td respectively.
Repeatability: comparable results under the same conditions
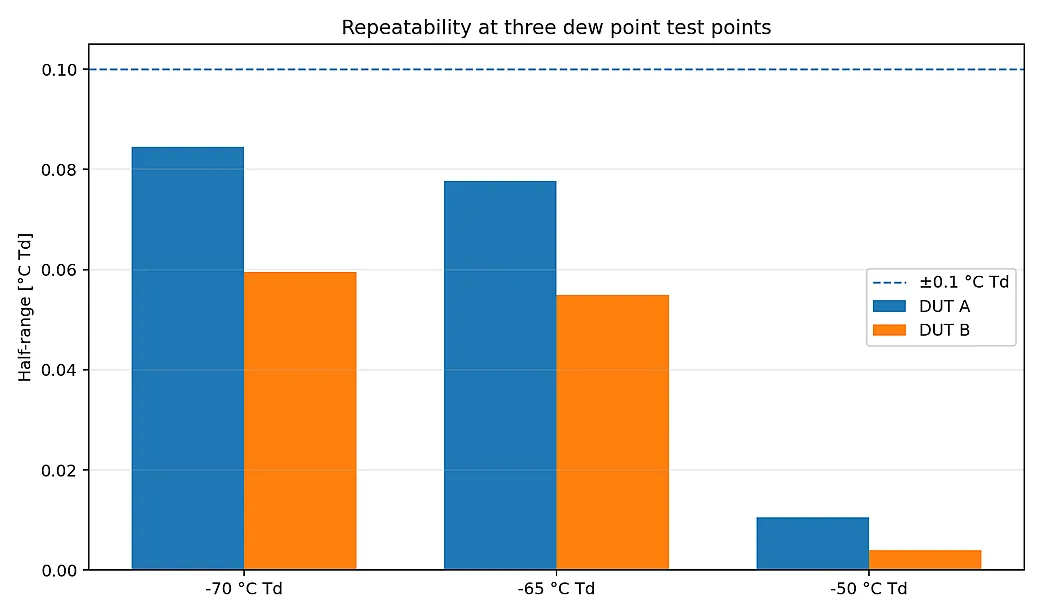
Repeatability was assessed using two TDS501 test units at −70, −65 and −50 °C Td. Each test point was stabilised for three hours; for the evaluation, the measured value immediately before the next change in the test point was used. The repeated measurements showed only very small deviations of less than ±0.1 °C Td at all three test points. The largest value was ±0.0845 °C Td.
Response time: fast reaction to a humidity step
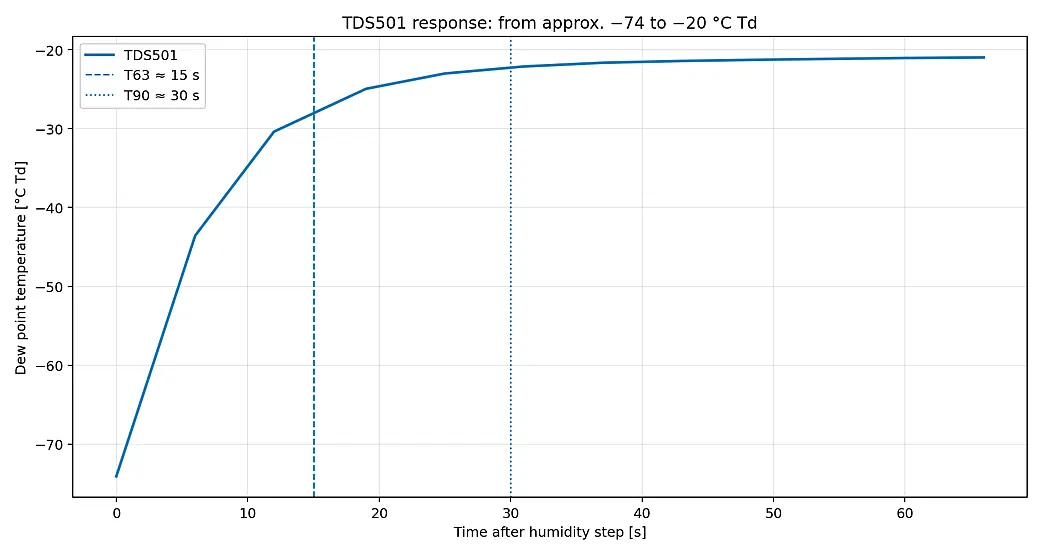
To simulate a high-moisture incident, a TDS501 was first operated for several hours in very dry air at approximately −74 °C Td. The test setup was then abruptly exposed to more humid air at around −20 °C Td. The sensor remained installed and in operation throughout the test. Evaluation of the step response gives a response time of approximately 15 seconds for T63 and approximately 30 seconds for T90. Major changes in dew point therefore become visible in the measurement signal at an early stage.
Condensation: still within specification after cyclic exposure
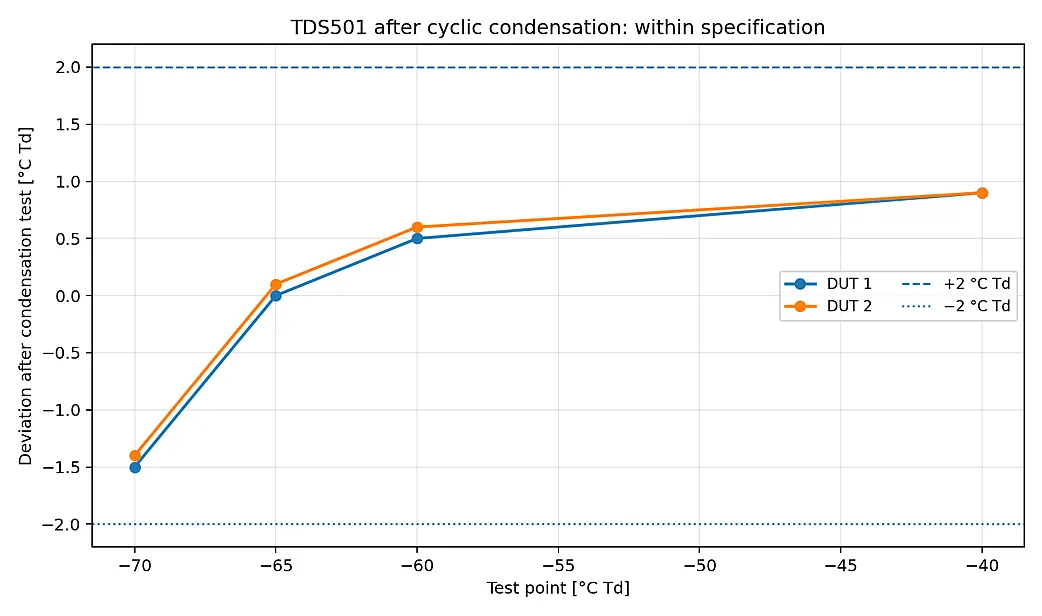
In compressed air applications, temporary condensation can occur in the event of faults or irregular operating conditions. To reproduce this stress, two TDS501 units underwent a condensation test based on EN 60068-2-30, a European standard specifying environmental testing procedures under high-humidity conditions. The test comprised twelve cycles of ten hours each at 93 ±3 % RH, with temperature changes between 20 ±3 °C and 0 ±3 °C. After the test, the characteristic curves were checked again at −70, −65, −60 and −40 °C Td. Both test units remained within the ±2 °C Td specification at all four test points.
The test demonstrates the measurement performance after cyclic condensation exposure. It should not be interpreted as a statement about continuous operation under condensation.
Uninterrupted measurements during auto-calibration
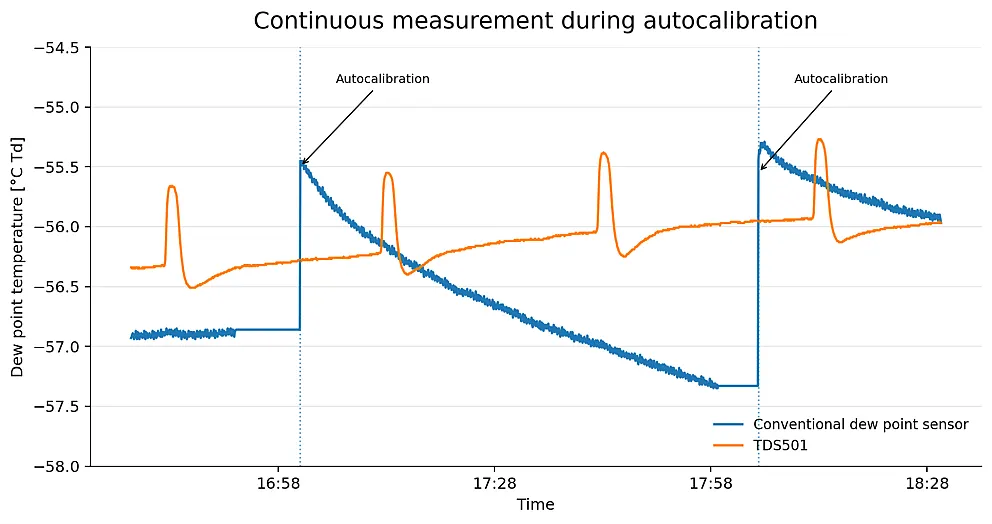
In addition to accuracy and stability, it is essential that the measured value remains continuously available during operation. In a dew point ramp from −70 to −65 °C Td at a rate of approximately 0.5 °C/min, the TDS501 continued to provide readings throughout auto-calibration; its influence was barely visible in the signal trace.
A comparison over approximately 40 hours at around −56 °C Td illustrates the difference compared with a conventional auto-calibration method. Both sensors produced comparable average values of −55.9 and −55.8 °C Td. However, the conventional sensor held its last measured value during auto-calibration and then showed a jump of approximately 1.5 to 2 °C. With the TDS501, there was no measurement interruption and the signal changes caused by auto-calibration were considerably smoother.
Measurement quality is more than an accuracy figure
The test series show that reliable dew point measurement is based on several characteristics: small deviation from the reference, stable readings over long periods, high repeatability, fast response to changes, robust behaviour after condensation exposure and continuous measurement output. Only the combination of these factors provides the basis for reliable process monitoring.